Thank you! Your submission has been received




Client: A large integrated steel producer. Service line: Strategic Growth Solutions.
At a glance
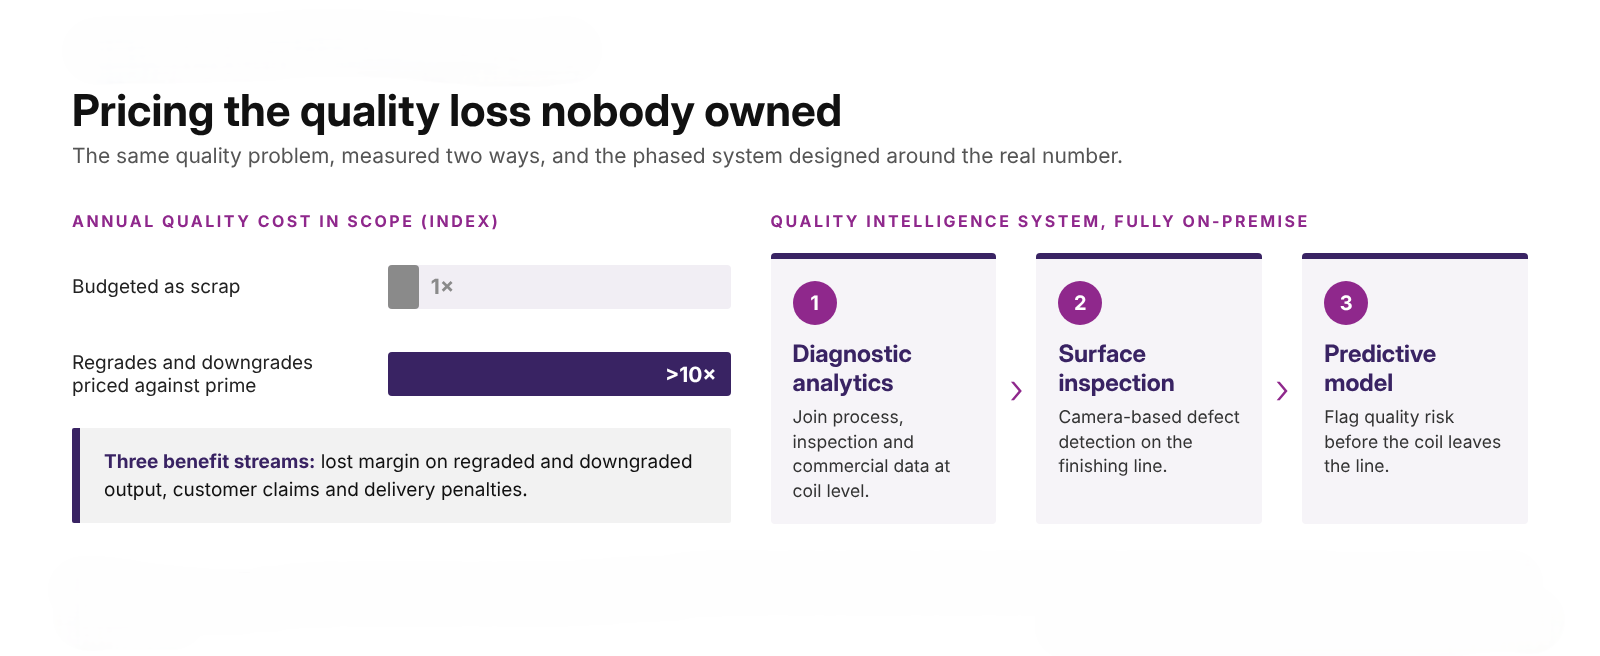
Quality cost re-priced at more than 10x the original estimate
Three loss streams identified and modelled
A 29-week, three-phase programme with acceptance gates
Fully on-premise design to meet national industrial cybersecurity rules
The question
Leadership asked whether AI-based inspection could reduce surface defects. The prior question was how much the quality problem actually cost, and where in the line it started.
The situation
The plant had sized its annual quality loss at roughly the cost of scrap. Monthly quality records told a different story: about 3% of output left the line regraded or downgraded, sold at a discount and reported as product mix rather than as quality cost. Process, inspection and commercial data each lived in separate systems, and inspection was manual and after the fact, limited by line speed.
Our approach
Discovery interviews with quality, production and IT leaders, followed by a two-day site assessment of the finishing line.
Hypothesis-led sessions with quality, production and finance, so every number in the cost model was challenged by the people who own it before it reached leadership.
Quality-cost reconstruction: regraded and downgraded volumes priced against the prime selling price, separating three loss streams (lost margin, customer claims and returns, delivery penalties).
A structured data assessment across seven dimensions to test what process, inspection and ERP data could support analytics, and at what granularity.
Technology due diligence: camera options compared on resolution, line rate and cost; image-storage sizing for a six-to-eight-month archive; a 29-question IT and data-governance questionnaire.
Commercial design: four delivery options (on-premise or cloud-assisted, full or analytics-only) and a split business and financial offer to support the client's internal approval.
What we delivered
A cost-of-quality model with documented sources and colour-coded assumptions.
A phased Quality Intelligence System design: Diagnose and model (weeks 1-9), camera-based surface-defect detection (weeks 10-19) and an on-premise predictive model (weeks 20-29), each with acceptance gates and measurable criteria.
A Phase 1 data-assessment toolkit, camera and back-end specification, storage architecture, IT governance questionnaire, project charter and full proposal set.
A board-level readout that translated the technical design into investment, risk and payback terms.
What we found
The real quality cost sat in margin given away on regrades and downgrades, not in scrap, so it never appeared in the quality budget.
Surface defects were found late, after the process conditions that created them had passed, which limited every decision to rework, downgrade or ship.
Most of the data needed already existed; it had simply never been joined at the level of the individual coil.
Any solution had to run fully on-premise, with no cloud dependency, to comply with national industrial cybersecurity requirements.
Root-cause hypotheses had to be tested by shift, steel grade and process parameter; averages across the line hid the patterns that mattered.
What changed
Leadership gained a defensible, finance-grade number for the cost of quality and a clear owner for it. The programme was reframed from an inspection project to a margin-recovery investment, and the phased, gated design went forward for business approval with acceptance criteria agreed up front.
What it shows
The largest quality losses in heavy manufacturing are rarely hidden by anyone. They are hidden by the way the business is measured. Pricing them is what turns an inspection idea into a board-level business case.
Facing a similar question? Talk to us about it.
Case notes are anonymised. Client names, figures and identifying details are withheld or generalised.