Ask a plant leadership team what poor quality costs them and the answer usually comes back as scrap tonnage and a figure for customer claims. Both are real. Both are recorded. And in our experience, together they are the smaller part of the problem.
In a recent diagnostic with a large steel producer, roughly three in every hundred tonnes left the line regraded or downgraded. None of it was scrapped. All of it was sold. Because it was sold, it never appeared as a quality loss. It appeared as slightly lower revenue, absorbed into the monthly numbers and explained away as product mix. Once we priced the gap between what that material should have earned and what it did earn, the annual figure ran into the millions of dollars. Nobody in the business had calculated it before, because no system was designed to.
That is the pattern worth understanding. The largest quality losses in heavy manufacturing are rarely hidden by anyone. They are hidden by the way the business is measured.
Why the number stays invisible
It is booked as revenue, not as cost. A downgraded coil generates an invoice. Finance sees a sale at a lower price; production sees an achieved tonnage target. The margin given away sits between two departments and belongs to neither.
The data lives in different places. Process parameters sit in one system, laboratory and inspection results in another, grading decisions in a third, and commercial outcomes in the ERP. Each is accurate on its own terms. None is joined to the others at the level of the individual coil, batch or lot, which is the only level at which cause and cost can be linked.
Defects are found late. Surface and dimensional defects are often detected at final inspection, long after the process conditions that created them have passed. By then the only decisions left are commercial ones: regrade, downgrade, rework or ship and hope.
Reporting lags reality. When performance is reviewed weekly or monthly from compiled spreadsheets, a drifting process can run for weeks before anyone sees it. The cost accumulates quietly in the meantime.
Below the waterline
We use a simple model with clients to make the full cost visible: the Quality Cost Iceberg. Above the waterline sit the costs every plant already tracks. Below it sit the costs that are real, recurring and almost never reported as quality cost.
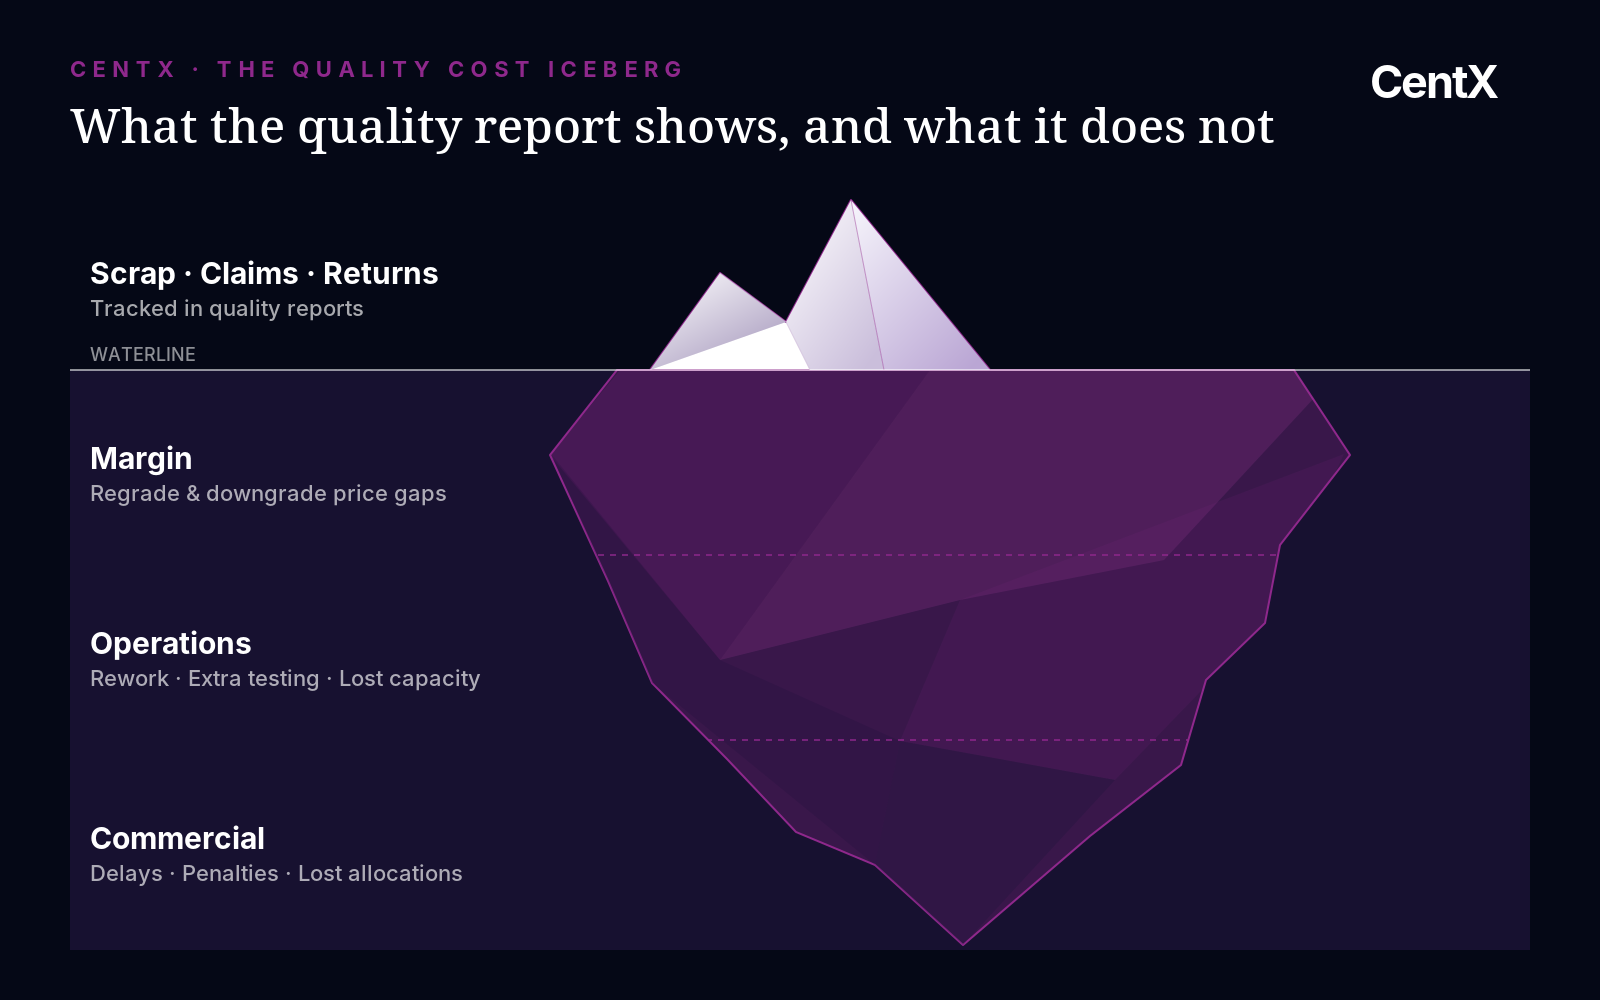
Above the waterline: scrap; customer claims and returns. Where it hides: already in quality reports.
Below, margin: regrade and downgrade price differentials; discounts conceded to retain customers. Where it hides: inside revenue, as "mix".
Below, operations: rework and reprocessing; extra testing and inspection labour; capacity consumed making material that is later downgraded. Where it hides: inside standard costs and overtime.
Below, commercial: shipment delays and penalties; lost or reduced export allocations; erosion of customer confidence. Where it hides: inside sales performance, rarely attributed.
The point of the model is not precision on day one. It is to stop treating the visible tip as the whole cost, and to give leadership a structured list of places to look.
Putting a defensible number on it
A credible quality-cost figure can be built in three passes, each using data the business already holds.
Confirmed baseline. Take the volumes you already record: scrapped, regraded, downgraded and reworked tonnage or units over the last twelve months. Confirm with quality and production that the figures are independent, not nested, so nothing is double-counted.
Price the gap. Apply the actual price differential between prime and regraded or downgraded product, plus the twelve-month value of claims and penalties. This pass usually produces the number that changes the conversation, because it converts tonnes into money finance recognises.
Add the hidden operations cost. Estimate rework, extra testing and the capacity consumed by material that ends up downgraded. Use conservative assumptions and show them openly; a lower number leadership trusts is worth more than a higher number they dispute.
In most plants the second pass alone is enough to justify action. The third makes the case robust.
From number to action
Quantifying the loss is the start, not the outcome. The value comes from linking each category of loss back to its cause, which requires joining process, inspection and commercial data at the level of the individual unit of production. Once that link exists, three things become possible: defects can be predicted from process conditions rather than discovered at final inspection; improvement effort can be ranked by money rather than by defect count; and progress can be tracked in the same currency finance uses.
This is where many improvement programmes stall. They identify the right problems but cannot show the money moving, so priorities drift back to output targets. Measuring quality loss as a financial figure, reviewed as often as production volume, is what keeps the work funded.
Three actions for this quarter
Ask for one number. Request the twelve-month value of regraded, downgraded and reworked output, priced at the real differential to prime. If nobody can produce it within a week, you have found the first gap.
Name an owner. Give one leader joint accountability across quality, production and commercial for that figure. Losses that belong to everyone are managed by no one.
Join the data for one line. Pick a single production line and link process, inspection and grading data at unit level for ninety days. It is the fastest way to see which process conditions drive the most expensive defects.
CentX combines structured analysis with execution discipline; so improvement priorities can move from insight to action.
Find out what poor quality is really costing you. Request a quality-cost diagnostic.
Yasser SharafAlDin is the Managing Director of CentX, a Dubai-based strategy and execution consultancy working across the Middle East and Africa. He spent 20 years in commercial leadership in the pharmaceutical industry across MEA before founding CentX.